







LEBANON — Recent data released by the International Organization for Migration (IOM) in September 2026 show changes in the size, geographic distribution and demographic composition of Lebanon’s migrant workforce, amid the country’s economic and financial crisis and the impact of the war between 2024 and 2026.
The number of migrant workers recorded in Lebanon fell by 35% between 2021 and 2022, from 207,696 to 135,420. The number then gradually increased to 176,504 in 2024, before declining again by around 7% to 164,490 in 2026. As a result, the total remained around 21% below its 2021 level.
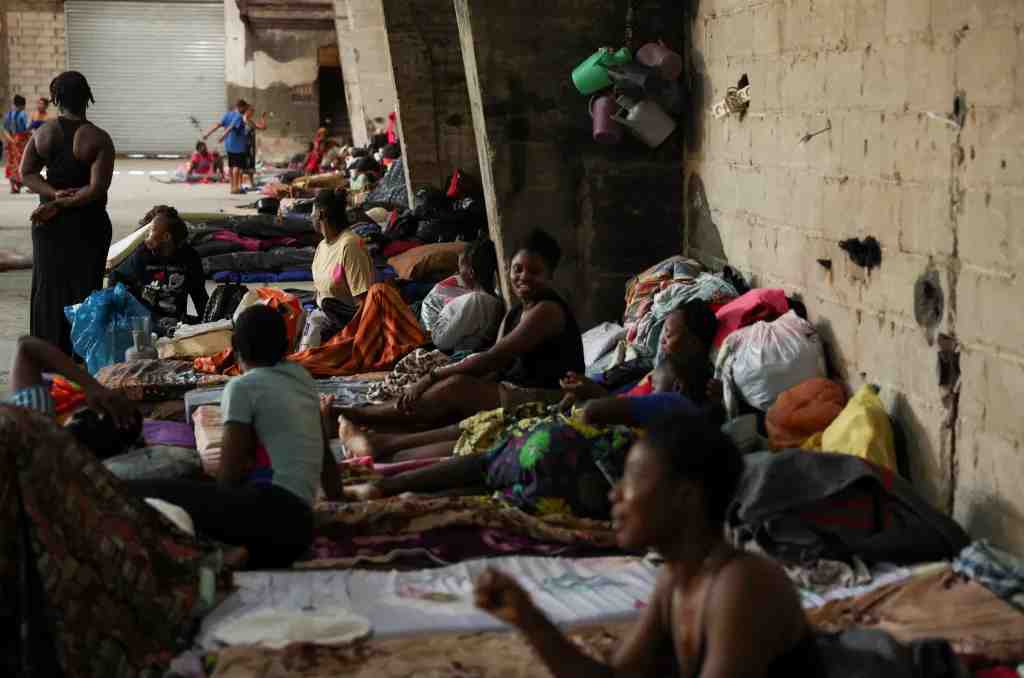
The decline coincided with inflation, the erosion of wages, rising prices and difficulties in transferring money abroad. Meanwhile, the war, displacement and loss of sources of income further increased the vulnerability of some migrant workers. The data also indicated that some employers abandoned migrant domestic workers without paying their outstanding wages.
Changes in the Composition of the Workforce
The composition of migrant workers by nationality has changed significantly. In 2026, Ethiopian and Bangladeshi workers accounted for around 65% of the total migrant workforce.
The share of Ethiopian workers increased from 31% in 2021, or 63,931 people, to 43% in 2026, representing 70,261 people. The share of Bangladeshi workers also increased, from 19% to 22%.
By contrast, the share of Egyptian workers fell from 9% in 2021, or 19,118 people, to 5% in 2026, or 8,255 people. The share of Sudanese workers increased from 6% to 9%, while Filipinos accounted for 8% of the migrant workforce in 2026.
Sri Lankan workers, who represented 8% of migrant workers in 2021, were included under the “other nationalities” category in the 2026 data.
According to the data, this shift is linked to Lebanese households’ ability to afford domestic workers amid declining incomes and rising living costs. The Philippines set a minimum wage for its domestic workers at $400 and later $500, while the majority of Ethiopian domestic workers earn around $150.
War Changes the Geographic Distribution
Military operations have also reshaped the geographic distribution of migrant workers across Lebanon’s governorates. Nabatieh recorded the largest decline, at 57%, while the number of migrant workers in the South fell by 18%.
Meanwhile, around 81% of migrant workers are concentrated in Beirut and Mount Lebanon, with Beirut alone accounting for approximately 26%. The report noted that the concentration of workers in a narrower labor market may increase competition and weaken their bargaining power over wages and working conditions.
Women at the Center of the Migrant Workforce
Women account for 71% of the migrant workforce, compared with 29% for men. Women make up 98% of Ethiopian and Filipino workers, while men account for 92% of Egyptian and 76% of Sudanese workers.
In addition, 52% of migrant workers live in their employers’ homes, and women make up 99% of this group. According to the report, linking workers’ employment, housing and legal status under the kafala system means that losing a job can also result in the loss of housing and residency status, increasing the vulnerability of migrant women and their exposure to exploitation.